Trend Data Modules


Catalyst Software


COMPANY OVERVIEW

Catalyst is a Customer Success Platform (CSP) that aims to center customer data in every organization and shift the focus of B2B revenue through customer-led growth. We help equip Customer Success organizations with data rich features, insights, and automation to manage their accounts at scale while increasing the odds of a customer renewing or expanding.

Our most common personas include the Customer Success Manager, the CS Ops/Admin, and the CS Leader. Each of these personas have different end goals and motivations and to quickly sum up:

  • Customer Success Manager (CSM) - owner of accounts whose primary role is to cater and service the needs of their customers. Often they are our “voice” of the customer

  • CS Ops/Admin - similar to Revenue Operations, they are the administrator of processes and tools for CS organizations

  • CS Leader - the Head of CS Teams that often report to the CEO and provides insights to the Board when it comes to customer health, renewals, and revenue forecasting

Our primary competitors include Gainsight, Vitally, ChurnZero, Planhat, and Totango to name a few if you’re curious to learn about this landscape and other offerings in this space.

catalyst_bkg.png

Problem Space

Problem Identification

Our Support team first signaled to us a consistent level of support requests coming from customers around our ‘Trends’ module offered on our Global “Layout” (aka a “dashboard” of modules). Since July ‘22 (~2 months prior to project scoping), we had 28 requests specifically about our Trends alone on top of 103 requests about reporting-like modules themselves.


28


Support requests
about Trends

103


Support requests about
reporting-like modules


PRODUCT OPPORTUNITY

One of the easiest and primary methods in helping a CS team detect risk or opportunity indicators from their respective customers is by visualizing when a field changes such as customer sentiment decreasing or product utilization is increasing. Customers crave the ability to show data and these changes over time to prompt action from their CSMs. E.g. Seeing the numeric Health score has dropped by -10% since the month prior should tell the CSM they need to shift their immediate focus to this customer. On a macro level, seeing field changes over time can provide CS Leaders and their organization the “big picture” of grouping trends across a CSMs’ Book of Business, industries, or company size segments.

At the time, we did not offer end users the ability to create a basic time series line chart that shows a historical view of any field changes over time. This forces customers to leave Catalyst in order to accomplish this in Google Sheets or SFDC.


ADDITIONAL INSIGHTS

From scanning our Product Board collection of insights on our ‘Trends’ module, we gathered 45+ unique customer requests around enhancing or changing our existing Trends module, making it one of the highest in-demand features for us to revisit across our entire roadmap. This alone equates to over $1.2m+ worth of annual recurring revenue (ARR). This feedback has shown that what was previously built is not effective.

A deeper look indicated that bringing our ‘Trends’ to the Account-object level was the highest feature in-demand alongside our ability to leverage Date Fields by months. The former, equating to roughly $525k+ in ARR.


+ unique customer requests
associated to Trends

45


+ worth of ARR associated
to Trends module

$1.2m


+ worth of ARR associated
to Account-level insights

$525k

Hypotheses

REBUILDING TRENDS

Rebuilding the concept of Trends “correctly” from what exists today is fundamental in paving the way for proper data analysis that customers expect to perform in Catalyst. This is required in order to create meaningful analysis of their own data, which can lead to performing the right actions.


new Account layout module

While we believe this should be consistently done across Catalyst, providing a new Account layout module for our quarterly scope will provide enough value for customers today. This safely opens up space for building this module properly from scratch and will be an opportunity for faster learning and iteration before expanding elsewhere (including our Global layout) since it is not currently offered in this area of the product.

  • According to our Staff FE Engineer, expanding this module to other object types (i.e. Accounts, Contacts, Opportunities, and Additional Objects) can be handled by the API and FE once historical data is properly being stored. This makes these objects potentially prime for a possible fast follow

  • Removing or replacing the existing ‘Trends’ module in our Global Layout is risky without ensuring work on the gaps from other reporting module types is completed (other internal priority)

Solution Space

Job Stories

Below is a list of the top four use cases that I drummed up throughout the course of early, exploratory customer discovery calls that highlights what we need to address in our solution, whether it be in our first version or a future iteration. This was also used to help align Design and Engineering on what our focus areas should be.


I want to… see changes to Health over time at account level

So that I can… intervene or trigger a Playbook if there’s a sudden drop in health score

Example: Highlight or alert me when Numeric Health score of an account drops by 10% MoM


I want to… see any significant % change in a field at the account level

So that I can… intervene myself or trigger a Playbook that will prompt the CSM to understand and improve customer sentiment

Example: Be alerted or see if any actions or initiatives positively or negatively impacted customer sentiment

I want to… see changes to DAU/MAU over time at the account or contact level

So that I can… understand if there’s an opportunity for upsell or they might move to at-risk based on their product usage level

Example: Show me a trending line of an account or user’s product engagement WoW or MoM


I want to… compare two data points or fields against one another by having them “overlay”

So that I can… understand if there’s direct correlation, causation, or lagging indication between these data points

Example: I can see two line charts of field changes to see how closely customer sentiment is a lagging indicator or correlates with Health or Forecasted NRR (examples)


Designs

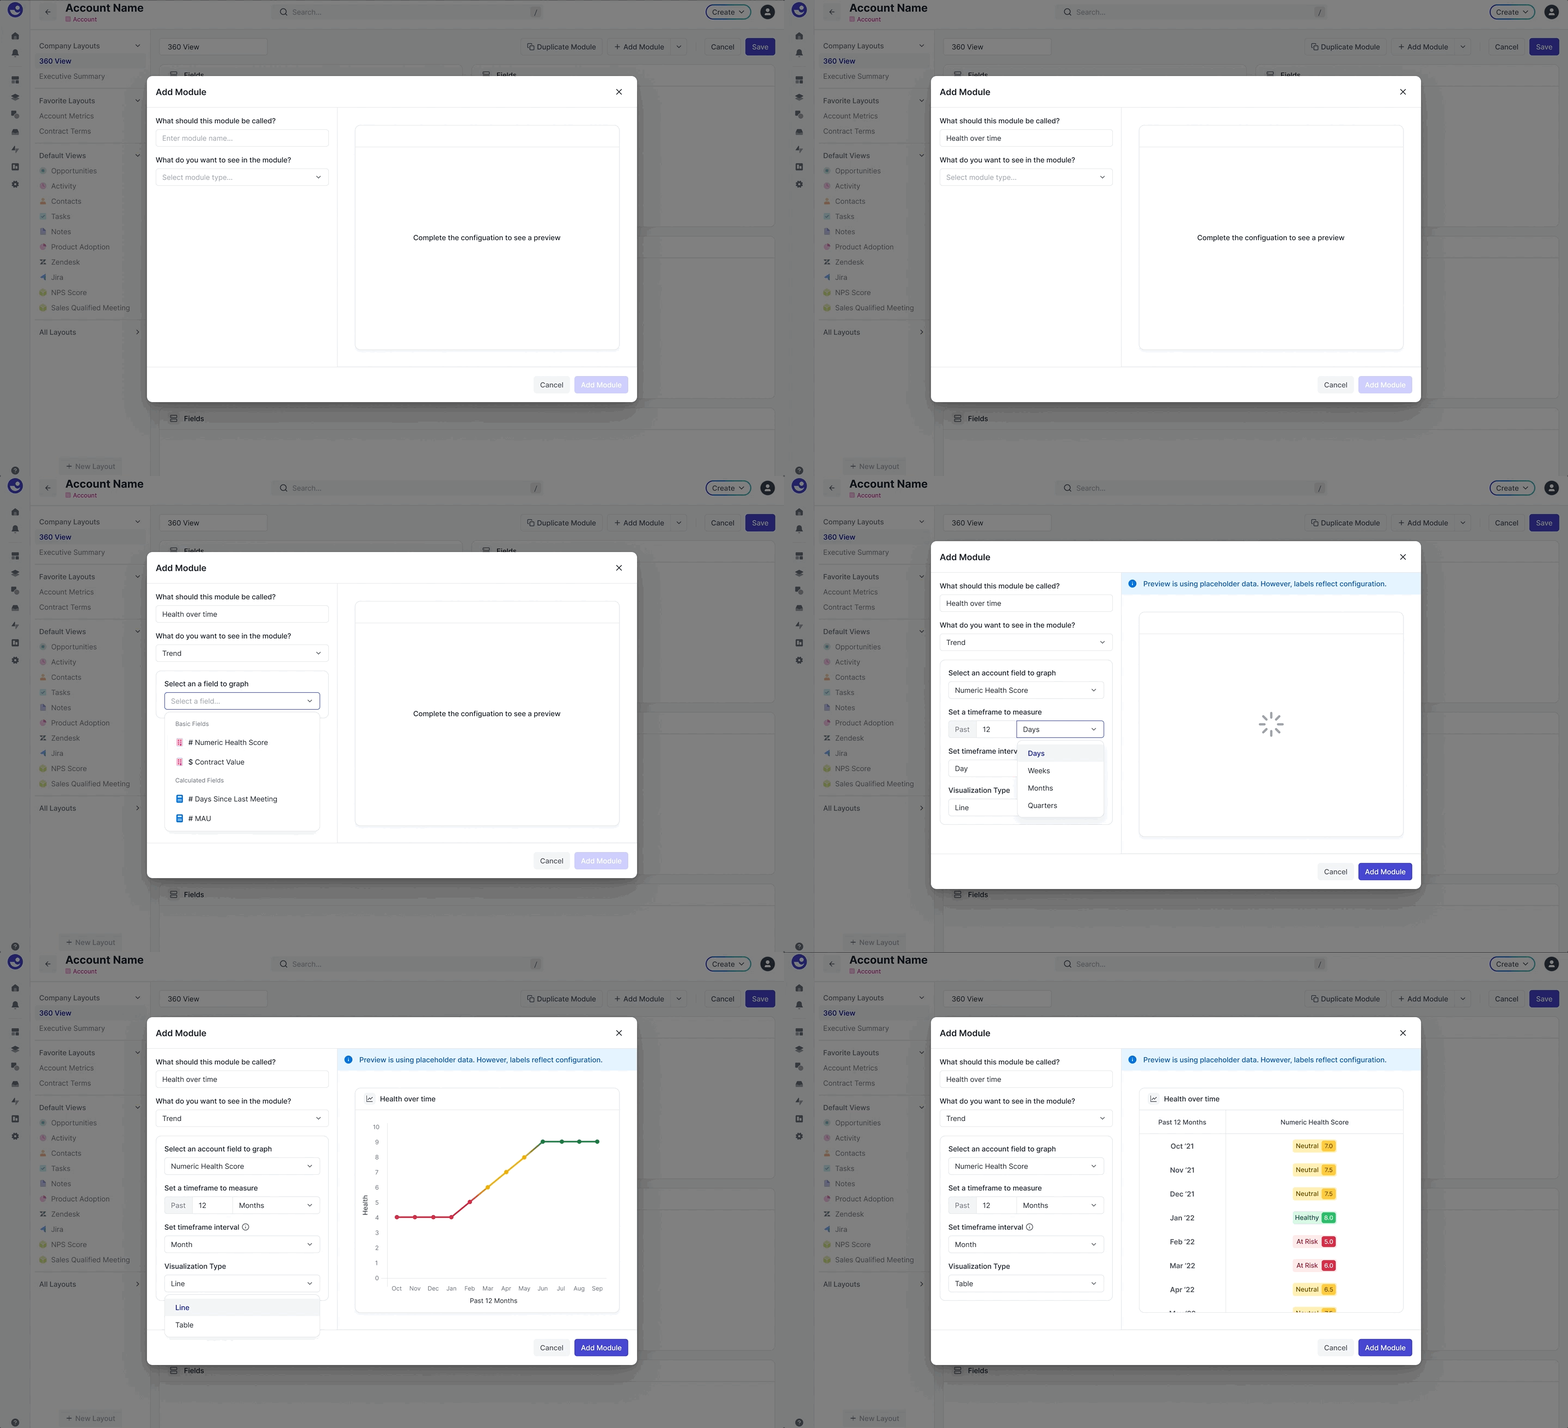
While we have many Figma frames that includes our earliest mockups, I thought I’d share a GIF of our first version’s prototype since it compiles much of our continued iterations into one succinct flow that we imagined how we could best solve for many of the above job stories (massive shoutouts to Marvin Martinez for his incredible Product Design partnership).


Requirements

Version 1

Our goal in our first version is to provide a new Account-layout module where users can trend any Account field and its historical data values over time. For the CS Ops persona, we want to deliver an intuitive and intelligent module building experience. The resulting visualization needs to help prompt action from CSMs with their customers.

Here’s how I translated our requirements for our Engineering team.

Data Types and Visualizations

To ensure we’re crystal clear on our various data field types and corresponding visualizations that are offered, I put this additional table together to map out options depending on the end user’s field selection.

Here’s how I outlined our field types and corresponding toggle options.

Event and Usage Tracking

Here’s a link to how we embedded our feature usage tracking and adoption to learn from our customers’ engagement and optimize through enhancements. This is key to understanding whether or not we’ve validated our hypotheses.

Release Events and Outcomes

We were able to accomplish creating a working version of our Account Trends module after 2 months of development (Nov, Dec ‘22) which mostly consisted of building a new trending data reporting database (capturing changing field values). The below shows a pasted version of our Release Planning and Events section.


Internal QA

  • Catalyst Main testing in staging and prod environments

  • Create at least 3 Account Trend modules that will be actively consumed by Catalyst CS

  • Test Plan link

Internal CS collaborators

  • Joe L - CS Ops at Catalyst

  • Kiko T - Sr CSM at Catalyst

Testing Timelines

  • FE, PM, and PD can start usability testing the week of Dec 5th in staging

  • Data and backend is dependent on the SL Team and may require us to wait until the week of Dec 19th for this validation (this ended up going until early January)

  • Joe and Kiko should be ready to build real Account Trends modules in Catalyst

  • We are able to internally test in production the second week of January (due to data pipeline issues, this took until the 3rd week of Jan)


Beta Testing

  • Targeting 5 beta customers

  • Each customer creates at least one Account Trend module that’s actively consumed by their CS organization

  • Target start date: Jan 31st, 2023

Customer candidate criteria

  • Must be MM or ENT segment, or fast growing SMB

  • Ideally, requested for Account Trend modules in past (see Product Board)

  • In ‘Neutral’ or ‘Healthy’ state unless requested by CSM

Approved candidate list

  • Attentive

  • Braze

  • Canva

  • Heap

  • StrongDM

EPD expectation

  • Production quality, feature is complete

  • Bugs that are flagged are immediately worked on and treated as ‘P1’

  • Reporting data team are actively merging optimizations

  • Data validation checks on-going


GA Release

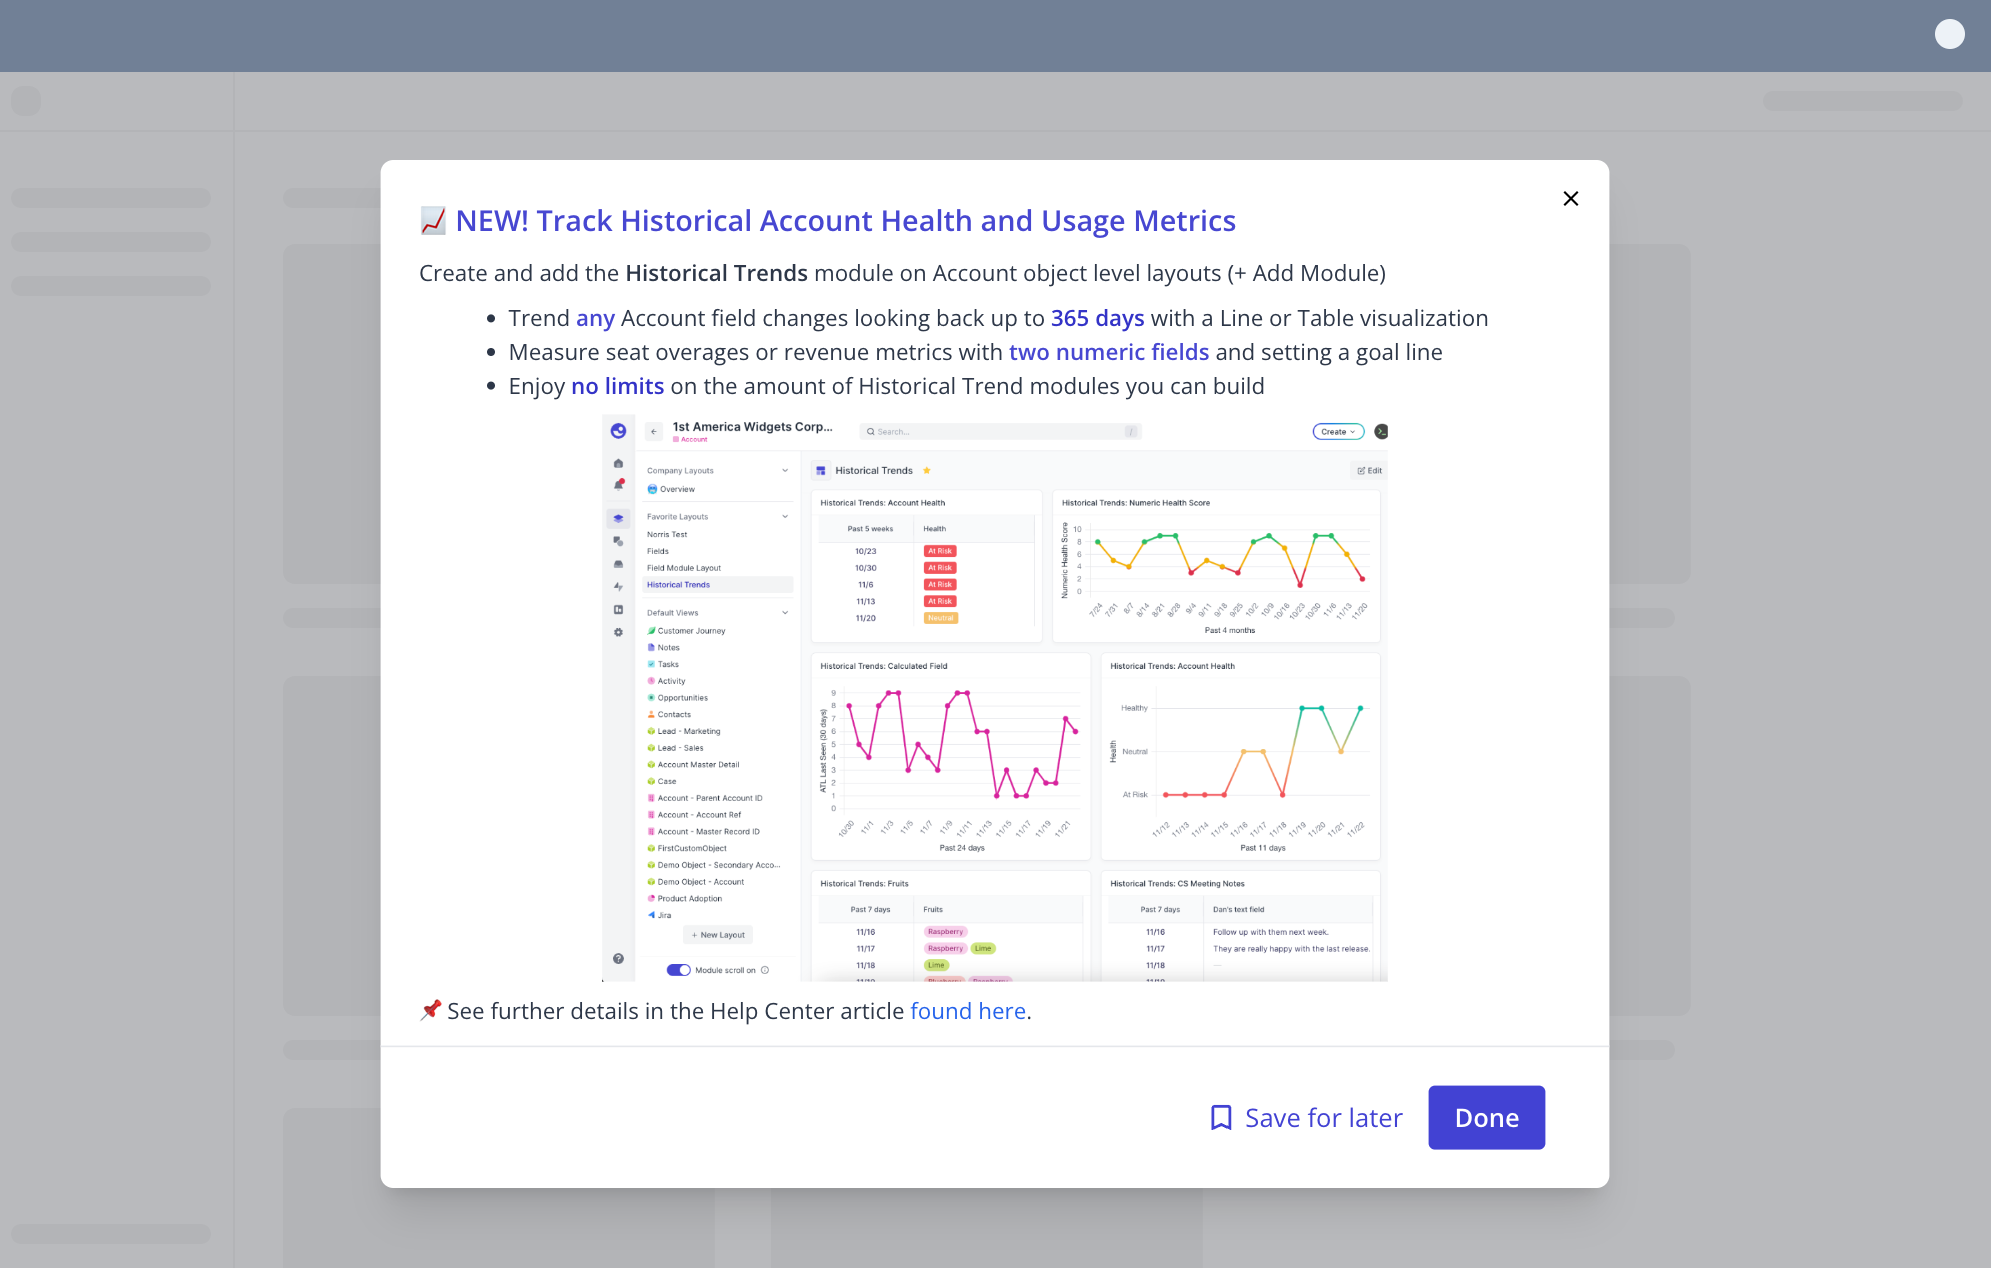
  • Releasing to all customers alongside an in-app announcement!

  • EPD Team ensures feature flags are removed and feature is fully accessible for all customers

  • Target start date: Feb 21st, 2023 (this was delayed to early March due to a few database bigs, a last minute planned company-wide Hackathon week, and PTO from key team members)

EPD expectation

  • Production quality, feature is complete

  • Monitoring and post-release is active

  • Reporting data team optimizations are merged


In-app announcement


30-day adoption

Within our first month since soft launch (without in-app announcement), we saw a 35% in adoption across our customer base. Today, over 53% of our customers are actively leveraging this feature.


customer adoption
after 30 days

>35%


customer adoption
after 60 days

>53%

Fast-follow Enhancements

On top of addressing typical performance optimizations for faster loading and fixing bugs throughout our Beta testing, we were able to add a couple of additional enhancements before launching.


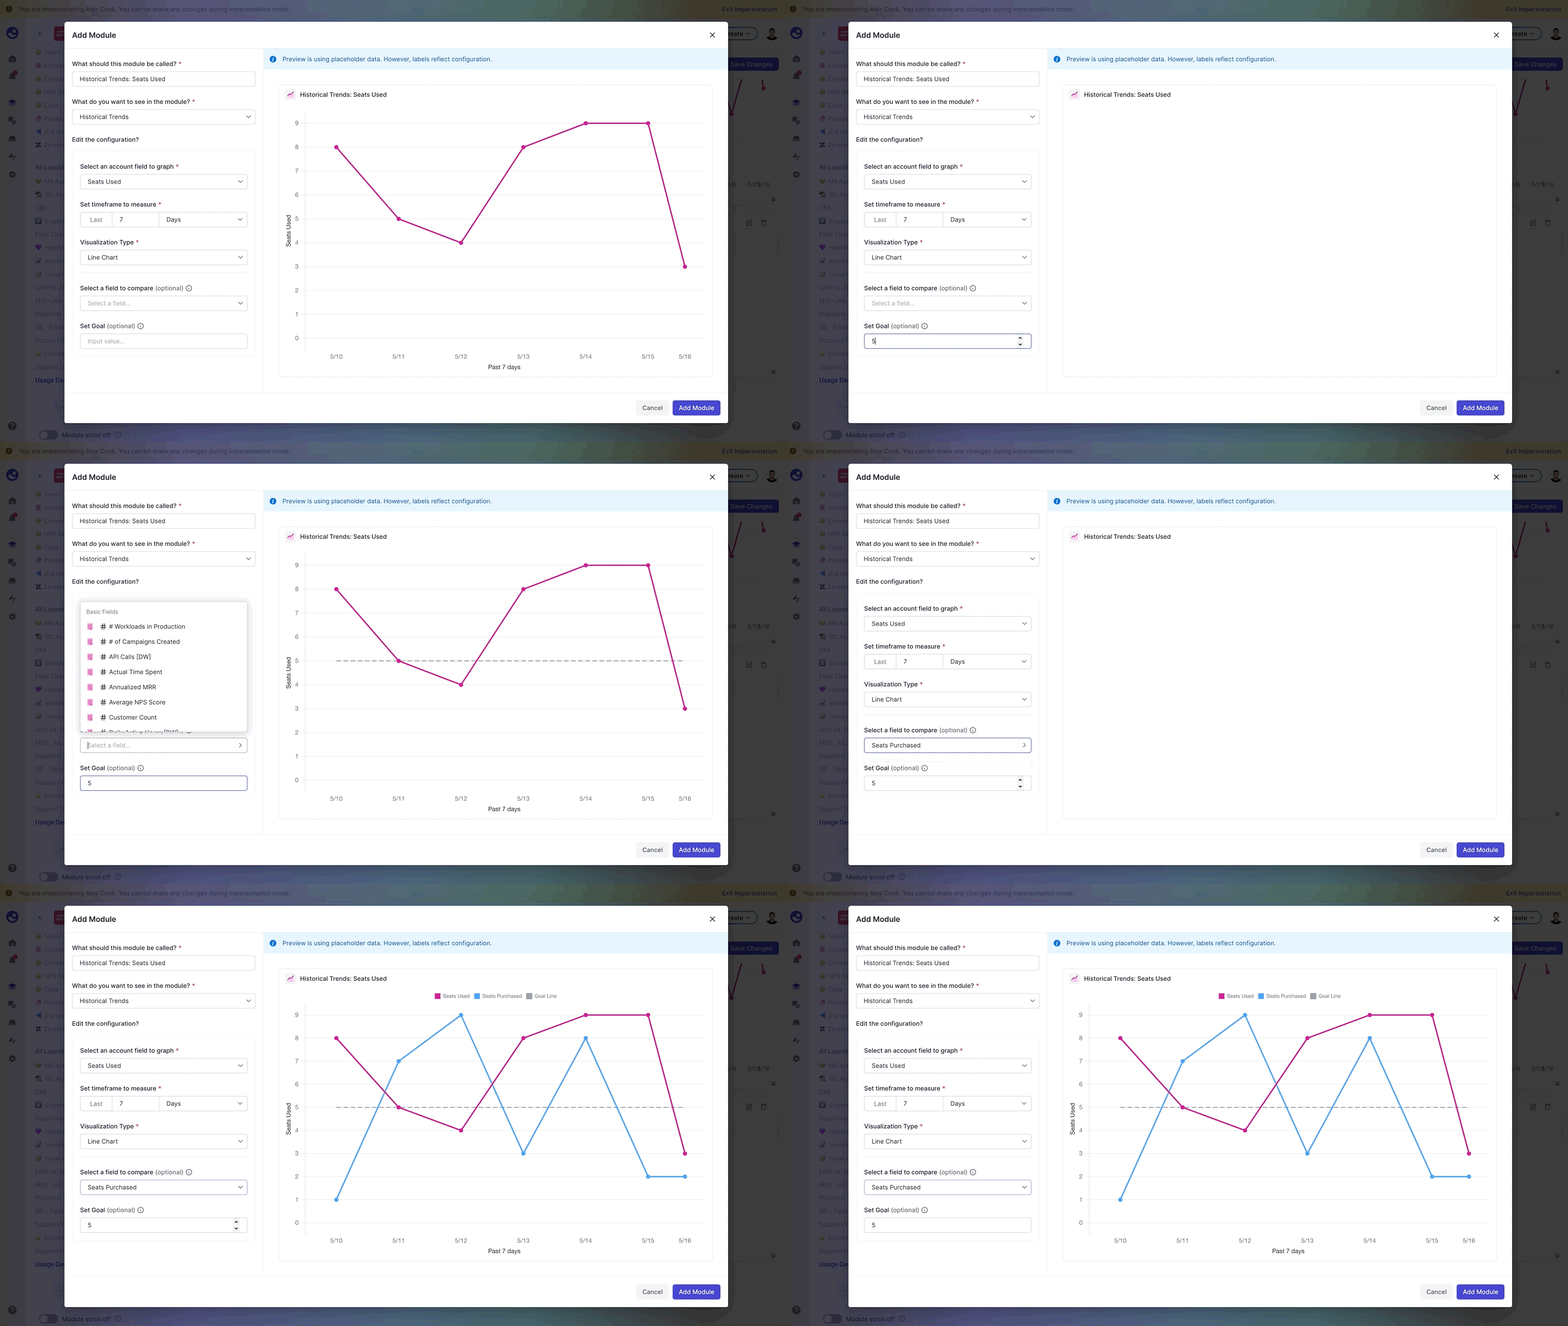
Selecting a field to compare and Goal line

From high customer demand, we decided to add the ability to compare two data points when a numeric field type is selected (and only allow for another numeric to be compared). In addition, an end user could also set a dotted-line along the Y-axis to more easily see if various data points fall above or below this visual threshold.


Current Version

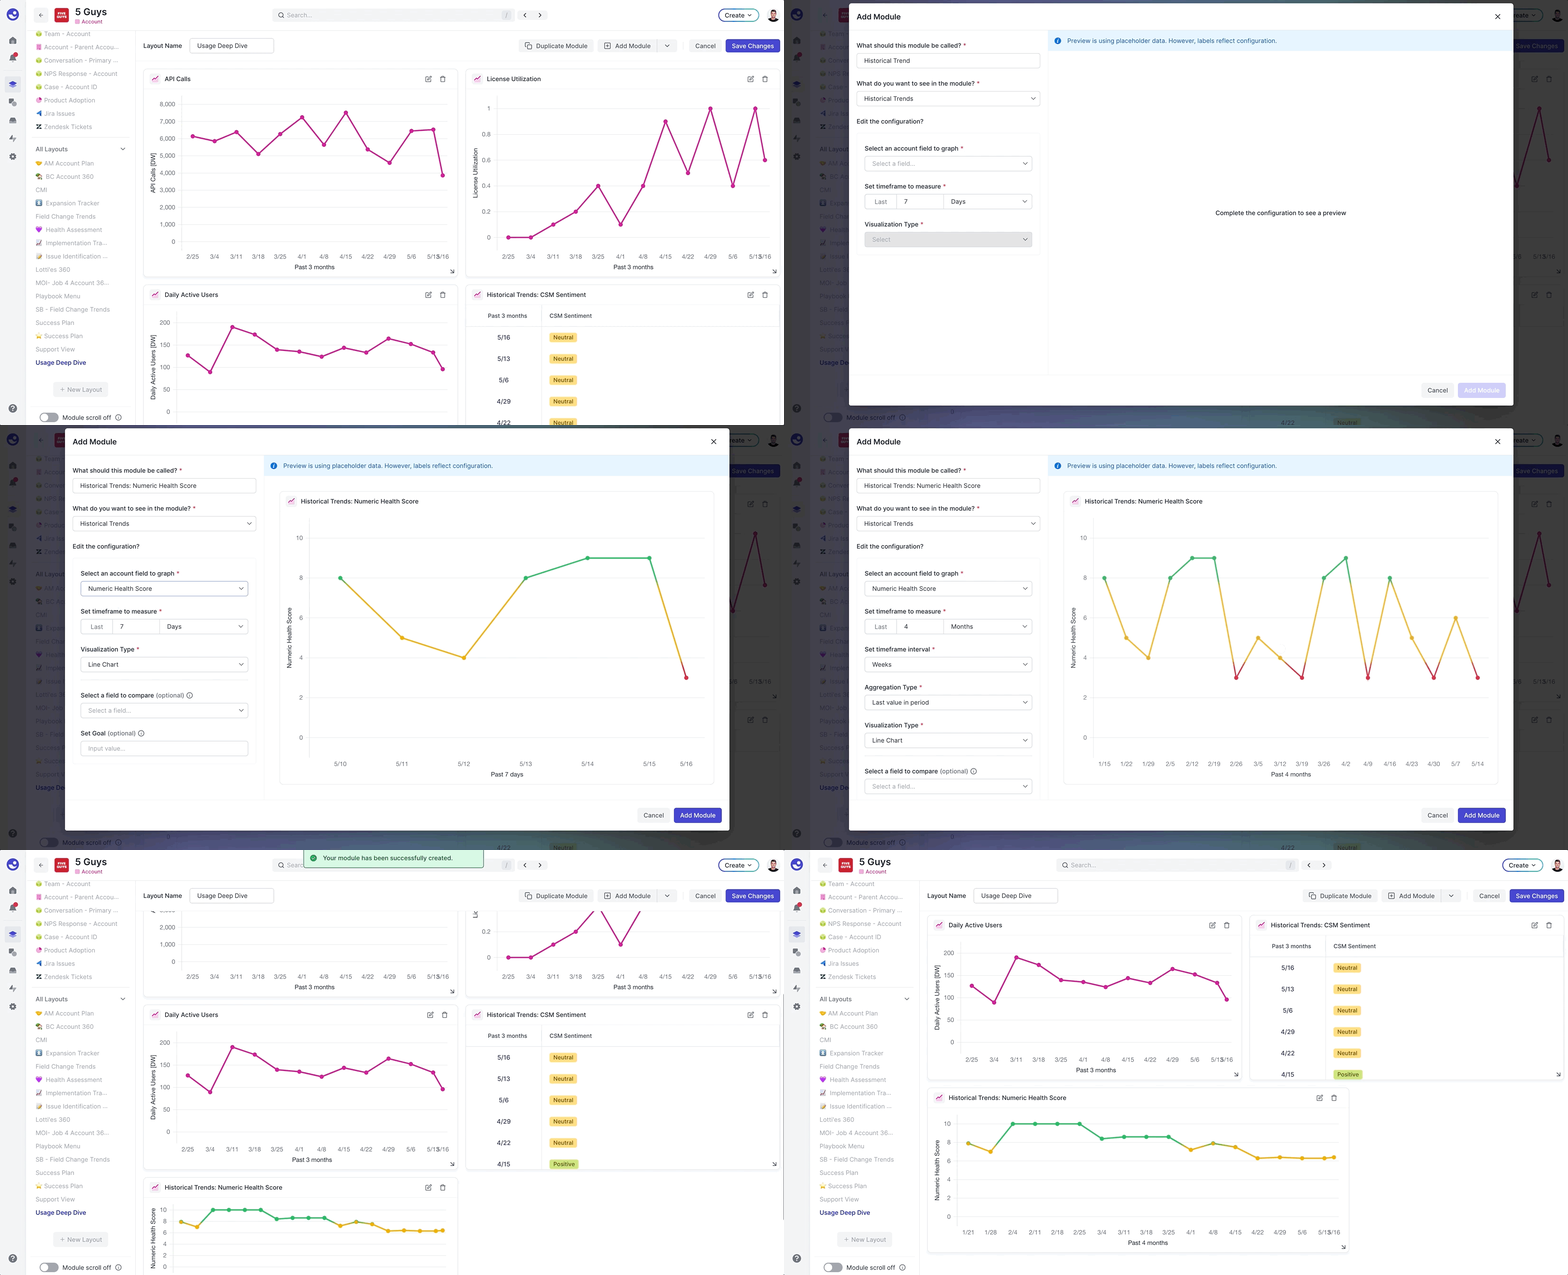
Here’s a GIF that showcases what our feature looks like today.